
You are currently browsing the category archive for the ‘climate change’ category.
 Mark Z. Jacobson has a new paper ” Impacts of Green New Deal Energy Plans on Grid Stability, Costs, Jobs, Health, and Climate in 143 Countries” and I made some comments on it in Twitter. I wasn’t impressed. The thread can be found here.

Risk? What risk? Photocredit.
Our abilities in predicting the future are very limited, but that does not stop people from trying. As a rule of thumb I would recommend not trusting those who seem most certain since they are most likely to hide risks and use their divinations for personal goals. In energy discussions one commonly occurring tool of divination is the “learning curve”. It tells that for each doubling of the capacity of some technology you get certain fractional change in unit costs (a bit more than 20% reduction in the photovoltaics module cost, for example). The message that is usually delivered is that even though something is costly now, it soon will not be… if we stay the course and double the capacity sufficiently many times. Very few acknowledge that the learning curve is not a law of nature, but rather a rule of thumb that might work…until it doesn’t. Discussion about implicit risks is almost always non-existent. In this post, I will dig into this issue a bit deeper highlighting some of the hidden risks involved.
To do this I will choose one specific future scenario and one specific technology. I choose to focus on the PV module costs, assume that we will increase the capacity by a factor of 100 to around 50TW by 2045. This implies (unrealistic in my opinion) exponential growth of the installed capacity with around 17% yearly growth (see figure below). This is somewhat artificial in a sense that for photovoltaics most of the costs are not from the module anymore, but I do this in any case to illustrate the math of the learning curve. I take the historical module costs and assume that technology has now matured and the module cost will remain the same from now on until 2045. What happens to our learning curves?

Capacity of photovoltaics in this thought experiment
As we proceed to the future, I recompute the learning curve every year by fitting the data to the new, stagnant, cost. We start with the learning rate somewhat above 20% today and then…almost nothing happens! How very exciting.

Learning rate from least square fit as capacity raised to around 50TW without any cost reductions.
To illustrate this I show below the learning curve at 2045 after almost 30 years
without cost reductions while capacity increased by a factor of 100. Learning curve fit is almost insensitive to the future costs since data points decades ago dominate the fit. It can enable the narrative of rapid cost reductions even after a generation of exponential growth without any cost reductions. It seems to be a tool perfectly designed to hide risks. It cannot identity when technology has matured (which might even be useful for marketers or thought leaders looking for lucrative career around single grand narrative).
There are ways to fix this though and the other fit demonstrates this. In this fit I choose to weight the points with the yearly installed capacity with the thought that data from building 100GW of panels is more informative than data from building 1MW. Now the fit does care about recently realized cost and the learning rate collapses. Fit is no longer good for points decades ago, but from the 2045 perspective it reflects what happened recently better.

Designed to enable hype ad infinitum. (Black line aims to get a more useful indicator. In the fit data points are weighted with installed capacity that year. Typo on y-axis label…should be $/kW.)
What would this imply for the costs of building all those panels? The last figure shows the required capital as a function of learning rate. There is an uncertainty of around 15000 billion $. If one only uses the highest learning rate, there is a possibility of understating the capital required for modules by a factor of around 4.

Panel investments as a function of learning rate. Factor of 4 underestimate possible. Who carries this risk? (Maybe another 30-40 trillion or so from balance of system costs?)
Things to ask/look for in cost studies:
- What was assumed about the learning effects? Constant learning ad infinitum for some techs and no learning for others? Is there a floor cost or not? There should be.
- Was the sensitivity for the learning rate analyzed? If not, then there is an attempt to burden someone (public) with risks (which is a cost) they were not informed about. As I wrote this I found this very recent presentation by Carrara et al., but it is worrying that this is not standard. Presentation tells us (see figure for example) that in our old friend REMIND-model PV share collapses from dominant to 10% range if learning stalls. Sensitivity is also asymmetric so that the sensitivity is larger for decreasing learning rates. Because of this one would imagine a need to be extra careful in identifying technology maturation.

PV share in the IAM models is very sensitive to assumed learning.
- Was the same learning rate used even after cost structure changed? For example, learning rates for PV are computed for modules, but costs are nowadays dominated by balance of system costs which have different (lower) “learning rate”. I have read countless of articles and publications where this change of the cost structure is casually ignored. Since the risk seems to be towards lower learning rates than assumed, there seems to be substantial risk of too rosy IAM scenarios in the literature.
- Are the costs prior to the imagined future costs discussed? It is bizarre, but some actually imagine costs for 2050 which they then use to make claims about economical options today. Cost comparisons become disconnected from the real world with this one handy trick.
In case you were wondering if obstinately sticking to a narrative well past its best before date could actually happen, see how the wind turbine costs have developed. Costs today are about the same as 15 years ago.

Cost of US wind turbines according to “Wind technologies market report 2017”. Costs today are about the same as 15 years ago.
Meanwhile for example IRENA (and many others) still use the learning curve as if nothing has happened. How come?

There is something funny going on on the right hand side don’t you think? Shouldn’t you be a bit more careful with those fits? “No there isn’t. No I shouldn’t.”: IRENA 2017
A Greenpeace report commissioned from 100%RE academics from Lappeenranta University of Technology (of course) on electricity generation costs was recently published in Journal of Cleaner Production. Details of the computations were kindly made available as a supplementary spreadsheet. The results left something to be desired. I wrote a response which has now been published. “Response to ‘A comparative analysis of electricity generation costs from renewable, fossil fuel and nuclear sources in G20 countries for the period 2015–2030’” (doi:10.1016/j.jclepro.2018.07.159). Link should work for few months after which you either need access to the journal or download it from here. Take away lesson as usual: Be critical and do not automatically trust the results or conclusions.
Added 18.10.2018: The free share link does not seem to work from WordPress so if you don’t have access otherwise you can download it from here.
People building integrated assessment models (IAMs) for IPCC (among others) nowadays use set of narratives called “Shared socioeconomic pathways” (SSPs). These narratives are used to justify inputs, assumptions, and constraints of the models. There appears to be 5 set of narratives with a goal of “covering the uncertainty space of challenges to adaptation and mitigation.” or “spanning a relevant range of uncertainty in societal futures”. I do not think they succeed at this sufficiently well. These narratives influence the outcomes of the models, but are naturally mainly windows into modellers minds and I am at difficulty in seeing what their point even is. They do encourage pigeonholing discussions around the narratives, but why would that be a good thing? Well, be that as it may, a brief summary of the narratives the way I see them:

Shared socioeconomic pathways according to O’Neill et al.
- SSP 1: This is clearly where good moral people are supposed to migrate. Word salad of lovely buzzwords. Assumes efficiency and carbon intensities far outside historical norms and seems to have inexplicably internalized anti-nuclear bias as if this would have something to do with the stated goals of sustainability and inclusive development. Interestingly it is also a narrative of fairly high economic growth. Certainly not dramatically different from SSP 2.
- SSP 2: “Middle of the road”…well that is not inspiring, but at least there is some attempt to stick to historical norms on issues like carbon intensity and efficiency improvements. Narrative for middle aged men in gray suits.
- SSP 3: This is the dystopia. Only bad person would like this to happen. I will mostly skip this.
- SSP 4: Here you have some pro-nuclear assumptions, but strangely it is coupled to a scenario with increasing inequalities. How this happened is unclear.
- SSP 5: “Fossil-fueled development—Taking the highway”. This one in fact has plenty of socially progressive elements (just like SSP 1), but as a poison pill it is attached to fossil fuels by assumption. This has more globalization than SSP 1 and has an emphasis on competition. High economic growth so that GDP at 2100 can be substantially higher than in SPP 1.

How the carbon intensity and energy intensities develop in different narratives? SSP 2 and SSP 4 baselines seem to start from historical norms. SSP 1 way off.
SSP 1 seems to have many nice things I endorse, but sadly I am afraid it is riddled in internal conflicts. The stated aims are not clearly consistent with what is actually fed into the computers. Case in point – bioenergy. Relating to SSP 1 modellers state: “The choice to interpret the SSP1 storyline consistent with the “global sustainability” scenario family is consistent with the storyline described in O’Neill et al. (2017). For instance, the important role for bio-energy, renewables and CCS (in the climate policy case) perfectly fit in this interpretation of the SSP1 storyline…” What? Some of the modelling results can be explored in this database. So lets have a look.

The 2.6 scenarios of the SSP 1 narrative typically see huge increases in biomass burning over the baseline. Very large fraction of this is supposed to happen with carbon capture which starts within next decade.
So SPP 1 narratives (and most others) typically end up with colossal role for bioenergy and so that very large fraction of that is equipped with carbon capture. Words: “sustainable path”, “respects environmental boundaries”, “lower resource intensity”. Actions: increase human appropriation of primary productivity massively without any serious consideration of social or ecological impacts. I spot a fairly serious problem here and this is a problem that has been around for a while (read my earlier observations on this here). Incentives for huge increases in bioenergy are created, but miraculously this would not affect food production or its yield development in any negative way and nor would it cause ecological damage worth mentioning. Gratefully criticism of this recklessness has been mounting and for a fresh summary I encourage you to read the column by Chelsey Harvey in the Scientific American.

Some typical bioenergy projections. Insanity across the narratives. All within planetary boundaries of course. #sarcasm

Implications of bioenergy expansion. Less natural habitats and more bioenergy plantations than farms for crops. Bioenergy volumes around 4x the crop volumes.
As I explored the narratives I noticed that I have been written out of existence. There is no narrative that represents me! An omission of this magnitude is clearly intolerable and I will try to start fixing it here. Below I provide a draft of my favoured narrative, but in case someone wishes to draft a better one, here is a link to a document and you are free to suggest improvements. Since SSP 1 assumes unjustified limitations on the acceptable toolboxes both technologically as well as socially, my narrative implies lower challenges to both mitigation and adaptation.
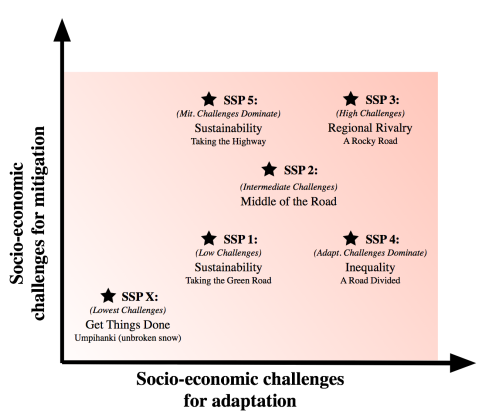
Fixed it! Umpihanki refers to a famous poem by Aaro Hellaakoski “Tietä käyden tien on vanki, vapaa on vain umpihanki.” Poor translation could be “Going by the road is to be imprisoned by the road, only free is the unbroken snow.”
SSP X – The missing pathway :

After a period of confusion world shifts towards prioritizing inclusive development and minimization of ecological damage. This transition is driven by increasing awareness of the endemic failure of climate policies as well as dissatisfaction in economic arrangements broadly considered as unfair and counter-productive. Educational and health investments accelerate the demographic transition, leading to a relatively low population. Driven by an increasing commitment to achieving development goals, inequality is reduced both across and within countries. At the same time, the improvements in human well-being, along with strong and flexible global, regional, and national institutions imply low challenges to adaptation. World places increasing faith in innovation and participatory societies to produce rapid technological progress and development of human capital as the path to sustainable development. There are also strong investments in health, education, and institutions to enhance human and social capital. International mobility is increased by gradually opening up labor markets as income disparities decrease.
Focus on results drives people towards pragmatic solutions and away from predetermined acceptable toolboxes and pathways. Grand narratives are seen as a sources of amusement and aids for imagination, but humanity is not constraint by them. All ecologically low impact tools for mitigation and adaptation are accepted, including non-biomass renewable energy, nuclear power, CCS, GMOs, and geoengineering as well as social changes influencing, for example, diets, car ownership, and urban planning. People realize the fundamental value of the broad set of options for themselves as well as for future generations.
How much is invested in which tool is a question approached pragmatically so that benefits are maximized relative to costs. World tries to learn as much as possible from the past experiences which implies planning based on historical trends for, for example, carbon and energy intensities and tools are evaluated according to their success in promoting deep decarbonization and human well-being.
Focus on effective decarbonization and adaptation lowers costs and reduces political obstacles for successful climate policies by reducing the political polarization around climate change. Pragmatism and humbleness towards our ability to predict and control the future, leads to policies providing broad support for R&D on mitigation and adaptation. Increased investments in broad technology portfolios lower the costs of technologies and guide future decisions on which solutions to scale rapidly. Uncertainty in projections makes people wary of allowing dreams of potential future technological solutions to constrain mitigation and adaptation portfolios today.
Increased environmental and social awareness implies desire to reduce biomass use and uncouple human activities from the biosphere. To support this, intensification of food production is strongly encouraged together with dietary changes towards plant based diets. Understanding the near term limitations of negative emissions, this narrative might be inconsistent with 2 degree goal. However, consistent with the narratives priorities, social and ecological goals take precedence over inflexible climate targets. Possible absence of 2 degrees (or 1.5 degrees) scenarios is not considered a failure, but a realistic acknowledgement of the situation.
Faster realization of failure, drives deeper understanding of the need for dramatic policy changes as well as for the long term need for adaptation and mitigation extending likely hundreds of years into the future. This values driven pragmatism implies faster mitigation and adaptation measures on the ground than in alternative narratives with impressive mitigation on spreadsheets. To promote longer term thinking, active policies are pursued to reduce scarcity mentality. This implies removing real scarcity among the most poor as well as reducing inequalities elsewhere. Confidence is built for adequate resources being available for worthy goals. Narrative is agnostic with respect to increased consumption or increased efficiency. If well-being is better promoted by increased consumption, then so be it. If goals are better achieved via efficiency, efficiency is pursued.
I ran into “Roadmaps towards sustainable energy futures”-project. It is a german funded project which has created a set of different scenarios for IAM simulations. They describe themselves:
“The Roadmaps towards Sustainable Energy futures (RoSE) project aims to provide a robust picture on energy sector transformation scenarios for reaching ambitious climate targets. A broad and systematic exploration of decarbonization scenarios for the energy system is indispensable for better understanding the prospects of achieving long-tern climate protection targets. RoSE is assessing the feasibility and costs of climate mitigation goals across different models, different policy regimes, and different reference assumptions relating to future population growth, economic development and fossil fuel availability, in order to provide vital insights into the overarching policy question: What are robust roadmaps for achieving a sustainable global energy future?”
Now I am not really a big fun of these modelling games since one tends to get out whatever one puts in and I have had a feeling that not all modellers model carefully enough. See my earlier post on this… However, ROSE-project has a database for the modelling results and let me just show what the 450ppm medium growth, medium population growth, and medium convergence scenarios ROSE211 give for the primary energy supply. I show bioenergy, non-bio renewables, and nuclear.

Insane amounts of bioenergy in all except IPAC

non-bio RE grows a lot. REMIND model extreme is this.

Wow! Colossal increase in nuclear generation from todays abut 10EJ/year. In REMIND reductions in the 2nd half of the century…for silly reasons.
See how two of the models actually see about 20-fold increase in nuclear generation. In those model scenarios capacity growth in the 2nd half of the century seems to be more than 100 GW/year (probably unrealistic). If I understood correctly REMIND model is a german model and even that sees dramatic increase in nuclear power until about 2060 after which it declines. They got this result by forcing it down by declaring world runs out of uranium at this time. This is an assumption other presumably considered silly, but which does have the benefit of creating a safe-space for german IAM modellers. I find it curious to observe the disconnect between the modelling results and how they are communicated in public.
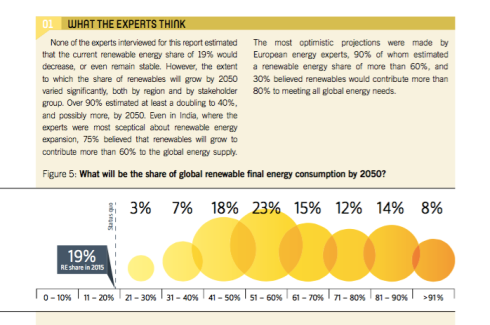
Renewables industry lobby group REN21 has published a new report “Renewables Global Futures Report 2017“. The report is written by Sven Teske who used to write similar reports together with the industry lobby groups for Greenpeace (some content has been copied from there). For this new report Teske et al. interviewed a bunch of “renowned energy experts” who were selected by asking for suggestions from…REN21! As a result of this careful selection process, they created a nice safe space of experts whose interests and preferences likely align well with the objectives of REN21. Success guaranteed!

Weird…
Strangely they then explain how they ranked each candidate according to their level of faith, but as far as I can see, nowhere do they either explain what their ranking was or how it was used. There is some discussion that seems to indicate that faith was strong mainly among europeans and among these germans and greens seemed to be strangely well represented. Go figure.

Increased demand. Those thinking demand will be lower in 2050 are outliers.
Now it is not too surprising that those interviewed have a relatively high level of faith in renewables, but it is more interesting to explore how their expectations actually align with serious climate policies. This report ignores actual emissions implication almost entirely and one can only wonder why? It is not, however, difficult to see the implications. First of all, even most of their carefully chosen experts foresee substantially increased energy demand.

“Expert debates within the climate and energy communities take place largely within their own silos…”
Bizarrely the report then seems to criticize its own experts by speculating on why they are wrong. So who were the renowned expert? Teske or the people interviewed?
More renewables, but lots of other stuff as well and how much of this is things like biofuels?
As for the share of renewables of the overall demand there were varying opinions, but it seems that median expected share in 2050 was around 50%. So lets put things together. Around 40% demand increase, maybe 50-60% RES share and we are left with maybe 30% emissions reductions from energy production by 2050. So sad. So their carefully selected experts do not, in fact, believe that renewables can deliver the kind of emissions reductions we need. Why didn’t Teske or REN21 highlight this? It does not promote happy talk for sure, but maybe time for happy talk is over and we should start feeling inspired by policies that would actually be meaningful. Grownups see the need for action on a broad front with all possible tools on the table.
PS. The report has also weirdly misleading spin. See below for an example. For those familiar with Teske’s past behavior this is not too surprising. When IPCC made the mistake of giving him the microphone when their SREN report (on renewables only energy issues) was released. He promptly used this as an opportunity to promote Greenpeace’s and industry’s E[R] scenario as representative of the SREN scenarios while ignoring contributions from most other authors. In reality E[R] was an extreme outlier even in the context where most authors were probably more kindly disposed towards renewables than the average.
Correction added 8.4: I misintepreted the below figure. (I thank Ikemeister for pointing this out.) The text talked about doubling (from 28%) so the claim is correct (although phrasing/spin could be clearer IMHO). I cannot resist pointing out how the text accompanying figure on RES share of final demand was crafted. Note that more than 60% share was guessed by about 49%. Text quotes higher figures by using subsamples from India and Europe. Desire to spin the right narrative was stronger than desire to use all the data.

No they didn’t. About 41% did. (note correction)
Added 8.4.2017: Note also how skewed the distribution of experts is. About half seem to be from few west european countries (most are germans), from Japan, or US. That is less than 10% of global population and from rich countries that are unlikely to determine the energy trends for humanity in the next decades.
Addition 13.4.2017: I will add a little news on the issue of “spin” since this happened almost at the same time as this post. Reuters relying on some Greenpeace report announced that China will spent a lot on solar and wind etc. Being a sort of guy who likes to go to actual sources, I tried to find it. I found a press release announcing this, but then had to follow a link to a Greenpeace-China page . Then from the very bottom of this chinese page I eventually found a link to the actual report (in chinese). I almost got a feeling they didn’t want people to actually read it. So of course I had to have a look and ran it through a translator. Below is the reports vision on chinese electricity supply and demand until 2030. The vision implies substantial increases in the use of fossil fuels. Increases in low carbon sources is inadequate to even cover the rising demand let alone decarbonize. One would think this would be relevant piece of information for public to know, but clearly Greenpeace thought otherwise.
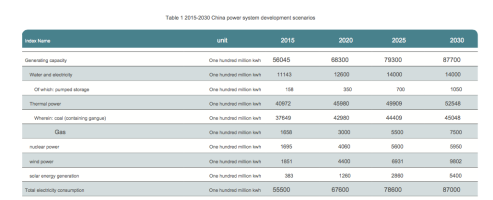
Vision implying climate failure.
In the earlier post I summarized my estimates on the limits to capacity utilization if production is done either with wind or solar power. Here I will (over)think implication a bit further.  On their own wind and solar power implied strong restrictions on achievable utilization rates. Overbuilding generation capacity (and associated distribution system) could increase utilization rates, but at the expense of ever increasing amount of wasted power and underutilized power lines. Storage could also help, but smoothing out the production profile would require large amount of underutilized storage capacity. There doesn’t seem to be away around this. Low capacity factor of variable power source has cascading effects elsewhere. If not fixed capacity utilization of end users would be strongly constrained and most likely too low to enable profitable business. On the other hand attempts to fix the problem would imply underutilized generators, power lines, and/or storage. Technical developments will not change this since the problem is not due to specific technology or costs. Are there ways around these problems? Of course…
If you are planning to invest in a new plant producing for example solar panels and you find production to be unprofitable with utilizations rates implied by solar power, your first choice is simply not to invest. If economic preconditions do not exist, production never materializes even if we might find such production desirable or even critically important. Production would either not happen or move to a place where higher utilization rates are possible. Various shades of gray might also exists as they do today especially in the developing world. If production process is such that you could for example store some parts for later use, it might be possible to outsource only those phases which require reliable power elsewhere. Of course, this still opens up possibilities for those not saddled with the same constraints.
Another option is not to rely solely on variable renewables, but to have a fleet of dispatchable generators delivering the power services variable renewables cannot deliver. Today this most likely implies burning fossil fuels, but in principle hydro and nuclear power would work as well. This again implies overbuilding infrastructure and is unlikely to be economically optimal. However this fundamental reliance on existing infrastructure is the order of the day in the developed world.
Visions where variable renewables dominate are aspirational marketing material while on the ground unholy alliance seems to have quietly developed between many renewable and fossil fuel lobbyists. Cozy reliance on fossil fuels enables somewhat more variable renewables to be built before technical limitations become apparent. Supporting this modest buildup (with public money) buys fossil fuel industry social licence as well as removes long term threat of actual decarbonization. Petty about the climate, but the constituency for whom this is actually a priority is weak. This is welcome also for many politicians who are only too happy to project an appearance of activity (at relatively low cost) while their policies imply changes which have a marginal impact on the actual problem. This relates to deep decarbonization in a same way as “champagne socialism” relates to revolution of the proletariat.
I recently read a very interesting book “Fossil Capital” by Andreas Malm on the history of industrial revolution in the United Kingdom. (Note: book is only worth reading until chapter 12. There the author got tired of thinking.) Malm focused on the question of why coal and steam engine won over water power in the early decades of the 19th century. Remarkably coal did not win because water resource would have been insufficient. There was still plenty of untapped potential in the UK. Also coal did not win because it was cheaper. In fact, mechanical power from steam engines was more costly and many were of the opinion that it was also of worse quality. So what happened?
There were many overlapping reasons. For example, factories followed labour to the cities. In the early 19th century it was already clear from the demographics that labour was to be found in the cities. Water power was dispersed and getting meek labour to run the machines in the middle of nowhere was harder. In fact, owners of water powered factories were relatively more dependent on the apprenticeship system providing them with, what can apparently with some justification be called, slave (child) labour. Water power was also more variable than steam, which made it even more important to have well behaved labour that would be willing to work long and irregular hours.
However, it turned out labour did not think their position was optimal (go figure) and started to make noise. This resulted in legal (and actually enforced) restrictions on working hours and gradual improvement on workers position. (It also induced technological change that made large number of especially troublesome workers redundant, but let us not talk about that here.) Owners did not of course like these limitations and lobbied against them, but relatively speaking those using steam found it easier to adapt. They could live with the shorter and more regular working week since reliable power could enable high productivity during working hours. Coal became the backbone of british industrial might and the road was opened for more broadly shared economic growth.
So can we learn something from this? I think we can since economic and social arguments for why coal won have not disappeared. If you listen to todays renewables promotion, you will be constantly bombarded with statements about how huge the potential energy resource is and how cheap it is…or is going to be any day now. Might it be a cause for concern that these two reasons were also promoted by water proponents in the 19th century Britain just when coal was taking over? Might there be a risk, we are discussing beside the point? If excessive reliance on variable renewables end up limiting capacity utilization, is there not a similar risk that water power faced in the 19th century? Who bears the cost of lower utilization? Labour? Lower salaries and/or more irregular working hours anyone? Vacations in the winter since solar power produces mainly in the summer? If push comes to shove and such questions have to be asked, I am quite sure any techno-fetishes we might have, will evaporate.
To me conclusion seems clear. It is unlikely humanity will ever be primarily powered by variable renewables. If fuel etc. costs for dispatchable generators are high compared to the cost of electricity from variable renewables, wind and solar might be economically justified as a part of a more diverse fleet of generators. However, it is also possible that on economic grounds they will remain niche producers whose existence is dependent on subsidies and political good will. Future will tell.
This will probably be a fairly long post mainly summarizing findings from my simple toy model….so proceed at your own peril. For a while I have been interested in how the properties of the power source affect the end user. For the consumer different power sources deliver very different value, but the public discussion is typically centered (more or less honestly) on costs. I think one issue of great relevance is the capacity utilization and the aim of this post is to record my studies on the matter. In particular I wish to explore the variable power sources such as wind and solar in the context of capacity utilization. My thoughts are in the end closely related to “capacity factor rule” discussed by John Morgan, but I approach the issue from somewhat different angle.
What is a capacity utilization and why it matters?

Capacity utilization in EU
Capacity utilization compares realized production with what could be possible. The concept seems to be somewhat fuzzy since theoretically maximum output could be defined in different ways. However, for an advanced economy capacity utilization is high, for example, in EU it is typically higher than 80% with a scary dip during last financial crisis. In an undeveloped country capacity utilization is lower, for example around 55% in Bangladesh. This makes sense, since things like poor infrastructure hamper production that might have otherwise happened. High capacity utilization is needed especially when lots of capital is spent since otherwise production could not cover capital costs. If high capacity utilization cannot be ensured, investments requiring large amounts of capital will not happen (unless one finds someone to pay for the losses).
In a developed economy capacity utlization is not really limited by the power supply. We get power from the plug whenever we need it. Capacity utilization is limited more by things like rising labour costs if one aims for maximum production or perhaps uncertainty on whether or not a buyer can be found for the product. However, our electricity production follows the demand and not all power sources can do that. Some view it desirable that consumers should in fact adjust their consumption according to weather. This raises the question: “How will this limit the capacity utlizations?”
This is a hard question and I can only scratch the surface here. I assume a “machine” or factory that can use certain amount of power and what is produces is proportional to its electricity consumption. I will then either use wind power or solar power as a power source and also add a storage to help even out the power variations. If there is excess power and storage is not full, we fill it. If power supply is lacking, we drain the storage. (I assume 80% round trip efficiency.) How much power machine can use, is a variable. It probably makes no sense for this to be higher than the wind or solar capacity, but if it is reduced utilization rate for the machine can probably be increased. It should be noted that the estimates below do not (of course) use the economists definitions for capacity utilization. This is more likely to give an estimate on the additional limitations on capacity utilization on top of all those other factors that are operating in any case.
So let me quickly summarize what I find…

Figure 2: Wind power source limited capacity utilization as a function of “machine capacity” (i.e. what fraction of power source capacity it can use) and storage (days at average wind production). Wind power data from UK 2013.

Figure 3: same as Figure 1, but using solar power as a source. (Production data from Germany 2015.)
Figures 2 and 3 show my rough estimates for the “capacity utilization” as a function of machine capacity and amount of storage (hours of average power production). If machine capacity is equal to the capacity of the power source, capacity utlization is limited by the capacity factor of the power source. As machine capacity is reduced and/or storage is added capacity utilization can increase. However it is very hard to get to a situation where power source would not be a factor substantially limiting the overall capacity utilization.
In terms of capacity utilization wind power tends to beat solar power which has strong seasonal production profile. Removing that is hard since it would require massive amounts of seasonal storage which would (by definition) be used only by about once a year.
As machine capacity is reduced, the “factory”can run at a higher capacity utilization, but then certain fraction of the produced power will be wasted although waste can be reduced somewhat by storage. If we aim for high capacity utilization, wasted fraction can unfortunately be substantial. The unit cost of useful energy will rise with increasing waste.

Figure 4: Fraction of wasted wind output.

Figure 5: Fraction of wasted solar output. (Once daily variation is covered it is very hard to change things by adding even more storage.)
Waste can be reduced with storage, but then the question arises that how efficiently this storage is being utilized? Figures 6 and 7 illustrates this. If we add so much storage that capacity utilization is high and amount of wasted power is low, we tend to have a large amount of under utilized storage capacity lying around. Storage that is combined with solar power tends to be more efficiently used because of regular daily variation.

Figure 6: How efficiently storage is being utilized with wind power. (Here the scale is more arbitrary. I assumed full utilization amounts to one full cycle a day.)

Figure 7: Same as figure 5, but with solar power.
I suspect that these estimates are in fact too optimistic. If I choose a point from figure 2 with relatively high “capacity utilization”, the power supply for the machine is still quite erratic as seen in Figure 8.

Figure 8: Example power input to the machines when machines powered by wind had a capacity of 0.26 of wind capacity and system had 36 hours of storage at average wind output. Still a mess.
Maybe there are processes that do not mind this, but there are also plenty of industrial processes where steady power supply is needed and where abrupt power cuts will undermine the economics of the plant. (It would be interesting to have real world examples of production economics as one changes between power sources. Do you know any? I suspect that current way of delivering power to industries in developed economies is close to optimal for their needs.)
I think I will stop here and discuss later what I think this will imply. Main point here is that nature of the power source will affect the capacity utilization and have economic consequences that are not accounted for when myopically computing the “cost” of electricity for the power sources.
Many celebrated the Paris climate meeting as being a turning point and were extatic of the new “ambitious” 1.5 degrees warming target. This target will be quickly reached and then exceeded massively. I think it is a cynical move to avoid acknowledging the colossal failure of the policies during past decades. If we are to have a reasonable change to stay below 1.5 degrees, cumulative emissions should stay below approximately 1000G tons. We have already emitted about 600 and are adding more at a rate of about 40 Gt per year so the “ceiling” will be crossed in short order.

NGO:s have been especially excited on the new target and for example Greenpeace kindly suggests their own plan (+GWEC+SolarPower Europe lobby groups) as a way forward.
“We will push our beautifully simple solution to climate change – 100% renewable energy for all – and make sure it is heard and embraced. From schoolyards in Greece, to the streetlights of India, to small Arctic communities like Clyde River in Canada, we will showcase the clean, renewable solutions that are already here, and pressure our governments to make them available for everyone, fast.” Kumi Naidoo
However, since GP plan implies much greater warming than 1.5 degrees, it is unclear why this plan should be followed. Let me elaborate.
Energy [R]evolution scenario is in fact quite critical of bioenergy. While this doesn’t often translate to consistent behavior at the organizations grass root level at least some understanding does exist. Report says:
- “Any bioenergy project should replace energy produced from fossil fuels. considering the entire production chain, above- ground and below-ground carbon stock changes and any indirect land use changes (ILUC), the net greenhouse gas emission reduction of such a project must be at least 50% compared to a natural gas reference, 60% compared to an oil reference and 70% compared to a coal reference. This net emission reduction must be realized within 20 years.
- “Greenhouse gas emissions as a result of indirect land use change (ILUC) must be integrated in the greenhouse gas calculation methodology of crops (including trees) for bioenergy, grown on agricultural land, by determining crop- specific ILUC-factors.”
They continue…”Despite this, all bioenergy is accounted for as climate neutral leading to an enormous carbon accounting error. Therefore, carbon accounting schemes should stop assuming ‘carbon neutrality’ of bioenergy and account for the net direct and indirect greenhouse gas performance of bioenergy as outlined in the sustainability criteria for bioenergy presented in this document.” (As an aside for my Finnish readers I would like to point out that GP sustainability criteria effectively exclude pretty much all forrest bioenergy here. It remains to be seen how long it takes for this realization to diffuse into local Greenpeace and other NGO:s.)
This is great and I agree! But then… why is that on pages 317-318, where E[R] scenario numbers are given, climate impacts of bioenergy and biofuels are absent?

Emissions also from outside the energy sector.
The report is also very silent on the emissions outside energy sector. For example, large fraction of the GHG emissions are due to agriculture. If we add the GHG emissions that Greenpeace+friends do not count, this would probably add roughly 10Gt of CO2 emissions a year.
I conclude with a short movie summarizing what Greenpeace+GWEC+SolarPower Europe figures actually imply. The first two columns are based on CO2 emissions reported in E[R] scenario. Third one adds 10G tons of GHG emissions that the report seemed to brush aside. It has always been clear that Greenpeace scenarios are widely unrealistic (for large number of reasons), but as is clear, E[R] scenarios are also inconsistent with the 1.5 degree target they celebrate. In fact, given that large fraction of emissions are unaccounted for the scenarios are unlikely to be consistent even with the earlier 2 degrees target. Other scenario builders typically add massive amounts of CCS with bioenergy to get negative emissions later on the century. Greenpeace is opposed to CCS (well of course) so we can safely assume the cognitive dissonance will only get worse. Since the substance is lacking on NGO proposals, should we really be outraged if substance is also missing from the official policies? Is anybody actually serious about this?

Estimate of the cumulative emissions in Greenpeace E[R] scenarios. (3rd column adds 10Gt of yearly GHG emissions from missing bioenergy emissions, agriculture etc.) Last column indicates the level below which we have reasonable chance to stay below 1.5 degrees.
I have written before how IEA sometimes hides politically inconvenient results in their reports. Now IRENA has published a new report “REmap: Roadmap for A Renewable Energy Future: 2016 Edition”. It naturally has a myopic focus on renewables which is the purpose of the organization. Nevertheless I was somewhat interested in their cost and capacity figures. In the next 15 years their REmap plan calls for a total investment of about 6000$ billion into wind and solar.

What does this spending buy? According to IRENA it buys about 1600 GW of wind power capacity, 1585 GW of PV capacity, and an explosion of installations into concentrated solar power so that its capacity would increase from about 4GW today to 110 GW at 2030.

If we assume an average global capacity factor for wind power to be about 25%, for PV about 15%, and CSP about 40%, we find that added wind and solar production corresponds to about 690 GWe of continuous production over the year. With 25 year lifetime, this means an electricity production of about 151 PWh. So without discounting etc. we would pay about 8.7$ billion/GWe for delivered (average) power. Capital costs would imply (without discounting and other expenses) about 4 cents/kWh cost of electricity.
IPCC 5th assessment report median nuclear overnight costs 4300$/kW. Let me again ask the naughty question since IRENA refused to compare options (1,5). What could we get, if we were to plough the money IRENA desires to spend for wind and solar into nuclear? I will round the cost to 5000$/kW for nicer figures. It really doesn’t matter. We could buy 1200GW of capacity which implies about 1100GW production at 90% capacity factor. Much more than than the 690GW IRENA bought. With 60 year lifetime, the actual production and reduced emissions are larger by a factor of about 4 and correspondingly the cost per kWh from non-discounted capital costs is around 1 cent. Estimates are so far apart that fiddling with details is not going to change anything.

Savings from external costs according to IRENA
IRENA also finds that their plan costs more than reference scenario (which is also not a cost minimizing option), but makes it alright by assigning externalities to the reference case (10,11, and 12). Outdoor and indoor pollution would be reduced by poor people burning less dung and biomass and some (smaller) savings also appear from reduced CO2 emissions. These are all savings that can just as well be assigned to the nuclear build-up sketched here except that savings would be considerably higher by hundreds of billions every year. Just sayin… (Of course I understand that at this point rules must somehow be changed.)
IRENA also states:
“Avoided investments in non-renewable power capacity alone are estimated at USD 1.5 trillion to 2030, or about USD 100 billion per year on average in the 15-year time period. Almost half of these savings would come from not building coal-fired power plants; another 30% from nuclear investments seen as no longer necessary. “
Mind boggles. No longer seen as necessary since authors proved themselves willing to impose additional costs on others? You do see that in the plan I outlined we would get much more savings in avoided investments than in the IRENA plan? Why settle for lower emission reductions? Have we been reducing emissions too rapidly? If you want to promote wind and solar, that is fine with me. But could you please make a case that somehow makes sense? Claiming that plans are economical even when it is manifestly clear they are anything but, undermines your message outside your echo chamber. Hopefully the plan is not dependent on everybody living in the same chamber. Not really my cup of tea. I rather stand in the rain outside.
P.S. Justifying climate action with external costs from indoor biomass burning and outdoor pollution is a dubious idea. Most of those costs can also be avoided by switching from dung and biomass to fossil fuels especially if appropriate pollution controls are used. Implicitly IRENA et al. base their logic on things NOT improving outside their chosen set of tools. This makes no sense.

