
You are currently browsing the monthly archive for January 2016.
Earlier I have made some observations on Mark Jacobson’s energy scenarios. See here and here. I continue my dumpster diving in this post with few storage related remarks. Let me start by showing Jacobson’s assumptions on energy storage in USA.

Jacobson et al.2015 assumptions on storage. Basically free. (Ignore the factor of 100 mistake in the 3rd column for UTES. They didn’t mean that.)
For UTES Jacobson has model in mind in Canada. “UTES storage is patterned after the seasonal and short-term district heating UTES system at the Drake Landing Community, Canada”. This is a group of 50 homes that get lot of their heat from solar thermal coupled to seasonal storage. Let us google…. and find a presentation by American association of Physics teachers. Boreholes, district loop, and short term storage alone had a cost of more than 20000$/home. This is far more than what IRENA says is the limit for financial attractiveness (0.25€/kWh investment cost). These houses were built only with generous subsidies from the public sector. Furthermore, if I read correctly the seasonal UTES system in Drake Landing can store about 12000 kWh per household. Of this about 60% is lost to the ground. So in Jacobson’s electricity heavy scheme we need almost 3 kWh of electricity in the summer to have 1 kWh of heat in the winter. If you compare the cost to heating with natural gas, there is easily an order of magnitude difference in favour of gas. Conveniently Jacobson et al. excluded other sectors than electricity sector in their cost discussions. Miraculously demand for an order of magnitude more expensive heat just appears to help solve the integration problems of 100% WWS scenario….Not that Jacobson would bother to mention the issue. Mind boggles. While we are thinking, how much would it cost to change american houses so that they would be heating from UTES systems? Let me guess… about 0.001…0.002 cents/household?
Incidentally Jacobson also has a soft spot for using cars to assist electrical grid. In 2011 he (and Delucchi) gave some cost estimates.

Delucchi and Jacobson 2011 on cost of vehicle to grid storage. Range 1.4-17.6 cents/kWh
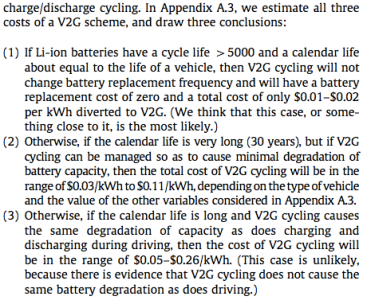
Delucchi and Jacobson intepreting V2G costs…

Some update! Vehicle to grid is also almost free.

This is getting too depressing and disorienting. Time for a drink.

100% WWS scenario together with Ethiopia. With his help 100% WWS is bound to become famous in Hollywood.
Jacobson et al. make a big deal about how their plan employs more people than current energy system. I already pointed out in the earlier post that jobs are a cost and not a benefit. For the wellbeing in the end it is the productivity that matters. Be that as it may, if you have a look at the Table 9 of the manuscript, something becomes clear. Not all countries will in fact have a positive “net earnings from jobs”. As a rule this number is positive for developed countries and many countries developing fast (like China), but many countries are “losing out”. Zambia, Zimbabwe, Nepal, Ethiopia, Mozambique… to name a few. If I have to guess why jobs were being lost in poor countries, I suspect it is due to Jacobson eliminating all jobs in bioenergy. (I share his dislike for bioenergy.) Even though his plan implies lower productivity than current rich world energy system, it is nevertheless more productive than the one many poor countries have today.
Jacobson et al. explain: “Although all countries together are expected to gain jobs, some countries, particularly those that currently extract significant fossil fuels (e.g., Kuwait, Iraq, Nigeria, Qatar, Saudi Arabia, Sudan, Venezuela, and Yemen) may experience net job loss in the energy production sector.” It seems that Jacobson et al. wished to frame this as a punishment for fossil fuel producers and for this narrative to make any sense, silence was required on all those undeveloped countries not producing fossil fuels whose “net earnings from jobs” was negative. And let me be clear. I don’t think productivity improvements in the energy sector is a bad thing. Obsessing over number of jobs in a sector is silly, but this is one of the main selling points Jacobson and others drafting renewables scenarios (like Greenpeace and RES lobby groups) have decided to use. They had to make a choice as to their target audience. Since the job number is positive in the rich world and that is where their target audience lives, it must be sold as a good thing. Too bad for the non-target audience.
Let us see how energy demand per capita develops in different countries. I have no time to go through all the entries and Jacobson’s use of Excel files makes this a tedious process. I choose few countries, some rich, some poor, some in Asia, some in Europe etc. and just give the results for them. (Notice that figures might have slight uncertainty in them, since I suspect Jacobson’s “end use demand” means something slightly different from the IEA figures for today, which he also kindly provides. So never mind about the last decimal point, it is the general trends that matter here.) The next figure compares consumption today to that in 2050 according to Jacobson et al. results.

Change in per capita energy demand by 2050

What?!
Since GDP is supposed to grow strongest in poor countries, as the next figure demonstrates, Jacobson also demands that energy efficiency improvements are most dramatic there.

Energy consumption/GDP today and 2050. (Inverse of energy intensity)
How do capital requirements compare with todays GDP? Next figure shows that while Jacobson surely hates Finland more than Sweden, it could have been worse.

Capital expenditure on generators relative to current GDP

Per capita consumption relative to Finns. Today (left) and 2050 (right). Relatively low consumptions implies high values.

Graph of hate relative to Finland as measured from energy consumption. If larger than one Mark wants worse for them than he wants for Finns.
5th of January 2016 Finns celebrate in Helsinki (-20 degrees Celcius) as they realize Mark hates Ethiopians even more. Just kidding… they celebrate Junior ice hockey world championship. Rest of the nation strangely cares more about that than energy discussions.

Mark Jacobson brought to you by Shell.
Let me elaborate. As a backbone of our energy system Mark Jacobson and his accomplices grant Finland 29 GW capacity of onshore windpower, 27 GW offshore, and almost 50 GW of photovoltaics. For reference notice that our maximum electricity demand is around 14GW in the winter and 9 GW in the summer. Total energy consumption is somewhat less than 400 TWh. In size we are about 1% of EU which has around 90GW of photovoltaics installed. So according to Mark on a windy sunny day production could be more than 10 times our demand and around 7 times the maximum (winter) demand. Our installed PV capacity would be comparable to whole PV capacity in EU today which has, after all, spent around 10 years constructing it. This all seems a bit intimidating.
Considering how off-scale this is it is noticeable that Jacobson spends very little time spelling out the details of how exactly are we supposed to cope with implied massive swings in production. From his excel file I cannot find details on what he assumed for our grid and how much his assumptions end up costing. He also says there won’t be any new hydropower (we have 3.2 GW), but there might be pumped hydro storage. They tell us “…we restrict our calculations to assume each country can generate all of its annually-averaged power independently of other countries, since ultimately this goal may reduce international conflict.” So that water will be sloshing somewhere in Finland since otherwise we might invade Sweden and Norway (and Russia while we are at it). Makes sense. If I read this correctly our hydropower is supposed to be configured in such a way that it pumps water upstream at massively higher powers than downstream. Somehow I feel we need a 2nd opinion from someone with actual competence in engineering. (Maybe Mark meant that we were supposed to use hydrogen storage somehow? Well, no he didn’t. According to him just 1.24 GW, out of total average demand close to 30 GW, or about half of the transport demand was diverted to electrolysis. Something very weird is happening behind the scenes and I have a nagging suspicion science fiction is involved.) Also note that our electricity demand is never less than about 6GW so potentially we are supposed to shut down the country for Mark. No problem!
Furthermore, why doesn’t Jacobson tell us where those mythical pumped hydro storages are? If you have a look at the topographic map of Finland, you will quickly realize why this is a critical question.

We are a mountainous country…by dutch standards.
Jacobson also suggests we get about 20% of our energy needs from photovoltaics. This made me laugh. Here is a picture from the moment when my power consumption for 2015 peaked.

20% of energy from photovoltaics. Sure Mark! Whatever you say
Of course a Finn would check the scenario not just for Finland, but also our dear neighbour Sweden. Sweden is about twice our size and has per capita GDP that is roughly comparable to ours. To remind you, according to Jacobson we are supposed to get around 20% of our energy from photovoltaics. Sweden on the other hand is inflicted just with around 1% share.
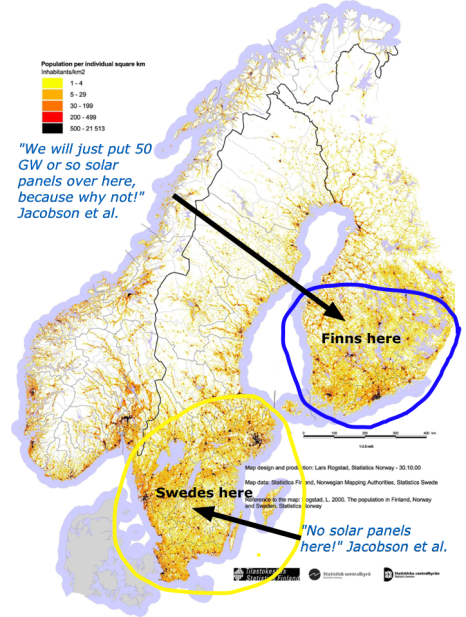
Mark lets us play on our strengths — sunshine!
In Jacobson’s vision employment in our energy sector grows from about 38000 to 130000. Doesn’t this mean massive productivity reduction in our energy sector? Isn’t that a bad thing? In the topsy-turvy world of 100% RES discussions this is of course not so. Jacobson instead talks as if we are winning by spending more. By inverting the logic of productivity increases that I suspect pretty much all economists (whether on the left or right) agree on, he talks of our $8.15 billion/year “earnings due to jobs” as if we are winning. Sweden would end up employing only about half what our energy sector would do (quarter on per capita basis) and they would get just 0.96 billion in earnings due to jobs. Take that Sweden!
How does Jacobson actually end up with the claim that his vision would make any economic sense? He gets this basically by estimating body counts from PM 2.5 emissions and then multiplying this by “the statistical value of life”. In this way he claims that in 2050 Finland emissions would kill 600-6000 people and cost us maybe more than $100 billion or about 30% of our GDP every year. Wow! This is crazy on steroids. First of all I think this is inappropriate use of the concept “statistical value of life” and 2nd it doesn’t pass the sanity check. Here PM emissions have declined drastically in past decades thanks to cleaner fuels, filters, centralized power plants replacing small scale burning etc. What am I supposed to learn from Jacobson’s figures? That in 80s when emissions were much higher, we lost basically all our GDP because of pollution? Also, is there someone who has a life insurance for 17 million. Isn’t maybe 100000-200000 more typical…1% of their claim? Jacobson and his friends assign pollution problems to the energy system as a whole and ignore that lot of it here is actually caused by small scale burning of bioenergy. They also deny the existence of alternative ways to address pollution concerns. History already tells they are incorrect in this assumption.

Small particle emissions from Finnish transport sector. Green for road transport, blue for water. (Lipasto, VTT)
P.S. Jacobson’s work is a treasure trove of nonsense and since I seem to like poking on carbage, I will probably return to it later. I name this post with “Part 1” for that reason.
Added 4.1.2016: I realized that Jacobson’s plan also assumes we spend about $12 billion on wave devices (almost 2GW capacity). It is a wonderful source of energy especially on the time of the year we need energy most. (More on this theme from the article by Soomere and Eelsalu. I thank @alexharv074 for the link.)

Does that white stuff matter? Photocredit La Brionnaise

