

Financial advisory and asset management firm Lazard regularly publishes a set of slides on the levelized cost of energy. These slides are routinely used to market wind and solar power (and are often annoyingly called “a report” which in my opinion gives them an undeserved aura of academic respectability). Alex Trembath has already pointed out that Lazards results are strange In this post I will point out some of the reasons why this is so.
In the early versions (v. 1-5) of their slides Lazard subtracted subsidies from the costs and then happily reported how competitive wind power was (point #2 on my short list). This was very naughty of them. Apparently somebody got too embarrassed by it and the trick was suspended. I think remorse is good and I am willing to forgive people acting in good faith. However, Lazard makes this harder for me since they seem to have replaced one form of misdirection with others.
Let me start by showing a slide slide Lazard uses to justify their figures.

Fig. 2: Lazard assumptions. 2015 incarnation.
Their range for wind power capacity factor is 30-55%. Wow! While 30% is close to what is typical in US, 55% seems awfully high. U.S. department of energy publishes “Wind technologies market report” which gives far more detailed picture so let us have a look. Figure 32 from the report seems useful and it shows a range of capacity factors in US. I will add into the figure red lines to mark ranges given by Lazard before and after they stopped the trickery with subtracting subsidies.

Fig. 3: Wind capacity factors according to “2014 wind technologies market report”
Hmmm…real data doesn’t seem to support 30-55% range. What Lazard has done is to use a lower range which is roughly typical in US and upper range higher than anything in the “Wind technologies market report”. The real lower range is missing. It should be around 10%, but they decided to use different “criteria” at one side of the distribution. Remarkably this nonsense seems to have started when they stopped subtracting subsidies from costs. Then assumed capacity factors started a rapid increase even though in the real data such increase has been very modest. If I have to guess, they did this in order to torture the numbers to conform to the narrative Lazard wanted to tell. They needed extra layer of nonsense to compensate for their earlier nonsense with subsidies. Otherwise “costs” would have shown a sudden jump.
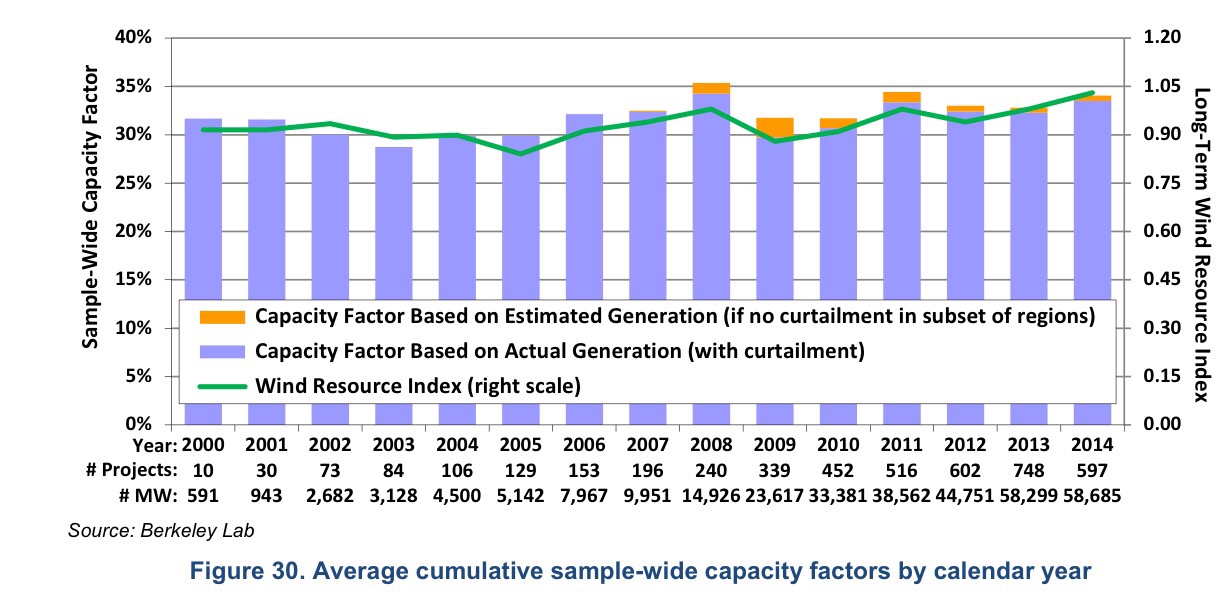
Fig. 4: Trend in US wind power capacity factors
What about the cost assumptions? The next figure compares the Lazard’s range with longer time series from US. The real data basically tells that in US wind power today costs about the same as 15 years ago. If you want a narrative a declining prices, you have to cherry pick 2009 as the high point and ignore the cost increases before that. (This is indeed what many including Lazard and even IPCC do.)

Fig. 5: Costs for US wind power projects. I marked Lazard’s range with green colour.
The range that Lazard gives for the costs is again distorted. Their lowest cost seems to be the lowest cost in US while the upper range is roughly a typical US cost. The real upper range has been mysteriously removed. The combined effect of these tricks is to make costs appear lower than what they typically are. Finally I typed Lazard’s upper range numbers into simple LCOE calculator provided by the national renewable energy laboratory. Lazard assumed “60% debt at 8% interest rate and 40% equity at 12%”. Since I don’t know exactly what that means and I am too lazy to figure it out, I will just use 10% discount rate. (That seems to give about the same result for nuclear power LCOE as Lazard states.) Why is it that I get 9.1 cents/kWh instead of something close to 7.7 cents/kWh that Lazard claims?

Fig 6: Why cannot I get about 7.7 cents/kWh? What am I doing wrong?
Does any of this matter? Who cares what some Wallstreet analyst says? Unfortunately, it does matter since gray literature a’la Lazard is being used as an excuse to deny the validity of more solid research. This is not only done by the media, but also by some academics. Here is an example of Stanford professor Mark Jacobson justifying ignoring results from “Deep decarbonization pathways project” for US, which did use proper sources for their data. (In fact, you might want to read his whole timeline during those days. I call that intellectual bankruptcy.) And make no mistake. Lazard knows exactly what they are doing. They know the figures and set out to deliberately twist them in order to mislead. This is unethical. By muddying the boundary between serious research and advocacy, they do disservice to both.

Addition: By the way…note that when Lazard claims 61% decrease in wind power costs since 2009 they don’t only cherry pick 2009 as the starting point, but also compute this by taking the average of their upper and lower ranges. This makes no sense. Computing such number for the median would be more sensible, but Lazard is very keen on NOT showing the actual distributions. They prefer to party with the outliers.


7 comments
Comments feed for this article
16/01/2016 at 12:51 AM
Energikostnader och ränta | Nej, det kan vi inte
[…] hävdar motsatsen. ”Bevis” kastas hit och dit, källors trovärdighet framhålls och ifrågasätts. Spännande nog påstås förnybart ofta vara såväl billigast som största jobb-generatorn, […]
16/01/2016 at 1:46 PM
Johan D
Great post. This study is widely quoted.
If you use 7.68% as discount rate you get 7.9 cents/kWh.
Lazard asumes a 40% tax rate which should be weighted together with the cost of debt part. This is how you calculate the WACC:
WACC = 0.6 x 8 x (1 – 0.4) + 0.4 x 12 = 7.68 %
16/01/2016 at 5:01 PM
Jani-Petri Martikainen
Thanks!
23/04/2018 at 3:15 PM
jmdesp
Sorry Johan, but I don’t see how your calculation can make sense.
You take 60% of 60% which means 24% of the capital is not accounted anywhere and gets a virtual 0% interest. This 24% number doesn’t correspond to anything we’re told.
17/12/2016 at 3:54 PM
Ikemeister
From the latest (version 10.0) Lazard report
also
This is the biggest issue I have with Lazard so-called “levelized” energy. They have one category for dispatchable i.e. “Conventional” power sources and another for intermittent renewables (IRE) and other “Alternate Energy” power sources. They don’t attempt to analyze the integration costs of intermittent production other than having yet another category for storage (which they don’t bother to study in this, their latest report). Many IRE promoters cite Lazard costs by comparing IRE with dispatchable power costs however then they are (perhaps unknowingly, perhaps deliberately) comparing apples to oranges.
Also note that the second quote points out that Lazard costs do NOT consider the costs of power outages due to IRE fuel not showing up.
WRT “potential social and environmental externalities”. I’m guessing that they are referring to, for instance, safety hazards and climate change risks.
Lazard only considers direct taxpayer subsidy (see page 17 “Methodology”) when many projects are justified on the basis of market regulations where the ratepayer foots the bill. How can that be considered leveling the playing field if ratepayer subsidization isn’t considered?
Here’s the fine print (CAPS and indent list formatting added for emphasis and clarity):
It seems they aren’t so much market analysts as they are lawyers. 🙂
19/06/2017 at 11:01 PM
Levelised Cost of Electricity – a Few Thoughts | The Actinide Age
[…] energy stocks, and has skin in the game as far as wind energy is concerned. The Finnish blogger Jani-Petri Martikainen has already cataloged some of the many thumbs Lazard puts on their scale to favor wind, and it’s no surprise that […]
16/11/2019 at 9:10 PM
Matter Beam
Great read, thanks for exposing this.