
Heysham nuclear power plant
In the second week of august EDF decided to shutdown their reactors in Heysham and Hartlepool.This was a precautionary measure after finding a defect in the boiler of Heysham unit 1. In total 4 reactors with total capacity of about 2.6 GW have been taken offline. Some were quick to declare that wind power came to the rescue when nuclear power was proven unreliable (for example Ari Phillips in Thinkprogress, Greenpeace, Giles Parkinson in reneweconomy.com.au…) More recently Justin McKeating from Greenpeace repeated the claim.
“…we see a reversal of the view that renewables need to be supported by nuclear power. Although nuclear and wind power do not have the same generation characteristics, nuclear reactors now needing to lean on renewables means the nuclear industry has a big problem.” Given that the claim appears unlikely on meteorological grounds and no evidence for it was provided, I felt a more careful scrutiny was called for.
So, did wind power replace missing nuclear capacity? Short answer is, no it did not. Missing nuclear generation was mostly replaced by increasing use of coal. In Figure 1 I show the output of relevant power sources in UK between Saturday 9.8 and Thursday 14.8. EDF reactors were ramped down during this period and this can be clearly seen in the figure. Equally clear is that when nuclear output was declining, wind power output was declining even more steeply. So rather than coming to the rescue, wind power was unfortunately galloping away when the action started. The reduction in the amount of wind and nuclear power, was mirrored by a clear increase in gas and coal power. Contrary to earlier claims, low carbon sources were replaced by fossil fuels.
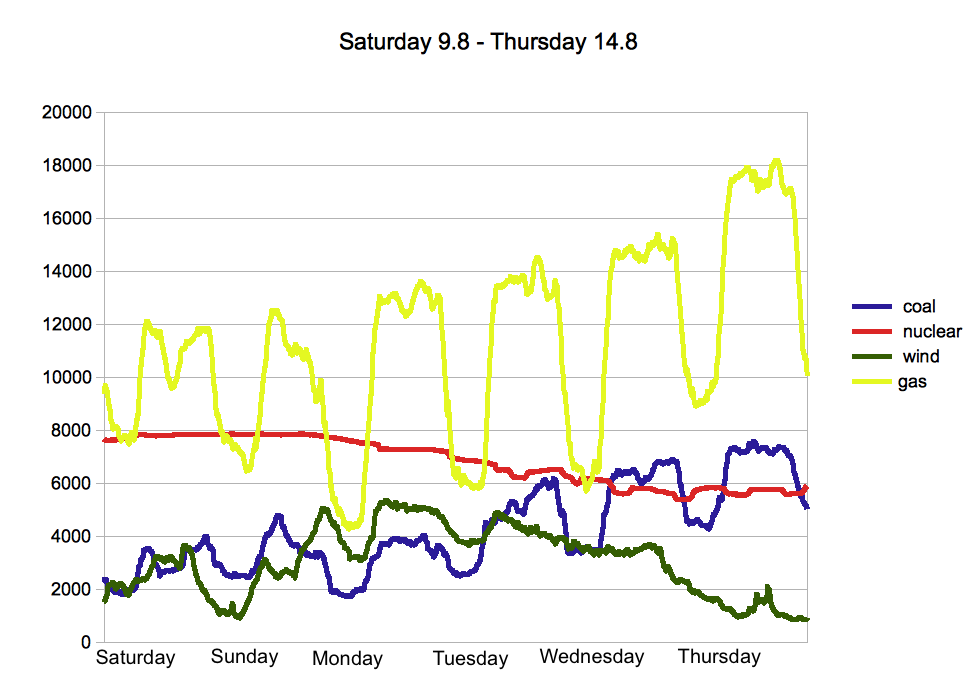
Fig 1: UK power production during the reactor shutdowns.
This quick check does provide the answer to our specific question, but with the data available we can learn more. In the following table I show the average power levels for the most relevant quantities shortly before and after the shutdowns. Most pronounced changes were in the amounts of power derived from fossil fuels, nuclear power, and wind power. There has also been some increase in hydropower generation.Recent weeks have in fact been more windy (not unusually so) than weeks prior to shutdowns and power generation from fossil fuels has increased slightly. However, as the earlier figure makes clear, to understand which power source is replacing which one must look deeper than averages.
| Period 27.7-9.8 [GW] | 14.8-28.8 [GW] | Change [GW] | |
| Demand | 30.4 | 30.3 | -0.1 |
| Nuclear | 7.9 | 6.0 | -1.9 |
| Wind | 1.3 | 2.3 | +1.0 |
| Gas | 12.4 | 11.5 | -0.9 |
| Coal | 4.6 | 6.1 | +1.5 |
| Interconnects | 2.6 | 2.6 | 0 |
To get a clearer insight as to how different power sources are connected in UK, we can inspect the data for the year 2013. Figure 2 shows the scatter plot of wind vs. gas for one month period in 2013 together with a least square fitted line. When wind generation is high, gas generation tends to be lower by almost the same amount as wind power generation. The color indicates power demand at that moment. As is clear there is clear gradient towards red with increasing use of gas demonstrating how gas power is used to meet increasing demand. Similar gradient is missing as wind power output increases. (Why did I take one month sample? If we do similar exercise over whole year, we will find spurious correlations between power sources since power demand has seasonal variability so that it peaks in the winter. Wind power production also tends to be higher in the winter. These suggest that if looked over the year, increasing amount of wind power would imply increasing coal and nuclear generation as well. This is clearly nonsense and correlation is caused by increasing base load demand in the winter and scheduled maintenance of nuclear power plants in the summer which happen to correlate with wind speeds. Aggregating the data to monthly sets removes most of these artifacts.)

Fig 2: Scatter plot of the wind power generation vs. generation with natural gas for a month around April 2013. Color indicates power demand at that moment.
What this kind of analysis reveals is that wind power has essentially no correlation with either monthly demand nor with nuclear power production. It does correlate strongly with gas power and less strongly with coal.
To figure out which power source is replacing which we should look at rate of changes in the output. This suggests that further insights may be gained by Fourier transforming into frequency space. Result is demonstrated in Figure 4. Demand shows clear peaks which indicate the familiar regularities. There is a strong peak at zero frequency corresponding to base load demand, there are peaks close to zero frequency corresponding to weekends, and then strong peaks corresponding to a period of about one day.
Nuclear power is strongly peaked at zero frequency demonstrating that it caters for the the base load demand. The peaks in demand have their matches in coal and especially in gas generation. Wind power has a broad featureless spectrum and in order for it to “replace” another power source, this other power source must have appreciable amplitudes at the same frequencies. Only for gas and to a lower extent coal power is this true.

Fig 3: Demand and production in frequency space. (Never mind the units along y-axis)
In conclusion, UK production and demand data suggest common sense relationships. Wind power acts mainly together with gas while missing EDF reactors were (sadly) mostly replaced by increasing the use of coal.
2.9.2014: Minor changes. The time period after shutdowns, in table with average power levels, was changed to start from thursday 14.8. Previous starting date included the ramp down as well.


6 comments
Comments feed for this article
30/08/2014 at 6:40 PM
Proteos
All this is well known. After all, there is no competition against wind, since it has priority on the grid. Wind production is only constrained by the total capacity installed and the weather conditions. In the short term, stoppages are counterbalanced by starting up power stations with a higher marginal cost.
We can certainly increase the number of wind turbines in the long term, but the weather conditions will remain highly variable from one day to another.
These press releases show only one thing: the organizations that issue them are deeply anti-nuclear. As it’s not politically correct for them to rejoice over ramping up coal, they tout renewables. They may dislike coal & gas, but they truly hate nuclear power and are not disturbed by replacing nuclear with coal or gas. Climate change is a secondary issue when the word ‘nuclear’ appears.
30/08/2014 at 7:08 PM
Jani-Petri Martikainen
Yep, couldn’t agree with you more.
03/09/2014 at 10:50 AM
Mark Pawelek
There was a fault found in one reactor, so 4 reactors were taken off line. Compound that with the recent loss of other power reactors and it looks like recently moth-balled coal plants may be fired up again this winter. UK is now running 1GWe below peak winter demand with no startegic reserve left
http://www.telegraph.co.uk/finance/newsbysector/energy/11070173/Emergency-measures-to-prevent-blackouts-this-winter-as-power-crunch-worsens.html
04/09/2014 at 4:14 PM
Kevin Myers on wind power in todays Sindo 31-08-2010 - Page 1038
[…] was provided, I felt a more careful scrutiny was called for.[quote] This of course is not true. How did the UK grid respond to losing few EDF nuclear reactors? | PassiiviIdentiteetti Sign in or Register Now to […]
01/10/2014 at 9:48 AM
Britain Switches To Coal During Nuclear Shutdown | The Global Warming Policy Forum (GWPF)
[…] Full post […]
06/10/2014 at 7:14 AM
Weekly Climate and Energy News Roundup #152 | Watts Up With That?
[…] https://passiiviidentiteetti.wordpress.com/2014/08/29/how-did-the-uk-grid-respond-to-losing-few-edf-n… […]